chart.js
Chart.js 是一个开源的的 js 图表库,它支持大多数常用的图表。之前就用过它来展示内存和 CPU 的监测结果,现在来回顾总结一下。
data
之前的版本我每行都有 KeyString 其实是有些冗余的,但在数据量不是特别大的时候,还是可以接受的。当然,最好还是用 csv 的格式,比较标准,这边就先这样。
1
2
3
4
5
6
| Time=2017-12-19T01:25:09;CPURate=0.00;MemRate=70.48
Time=2017-12-19T01:25:11;CPURate=27.97;MemRate=70.43
Time=2017-12-19T01:25:13;CPURate=37.07;MemRate=70.00
...
Time=2017-12-19T01:27:08;CPURate=41.62;MemRate=69.48
Time=2017-12-19T01:27:10;CPURate=38.41;MemRate=69.51
|
js libs
1
2
3
4
| <script src="js/jquery-3.2.1.js"></script>
<script src="js/Chart.bundle.js"></script>
<script src="js/utils.js"></script>
<script src="js/moment.js"></script>
|
这边我引入了 jquery 来操作 DOM,Chart.bundle.js 则是 chart.js 的核心库,并且其中已经打包了一些第三方库。可以在它的 github 上看到有不同的版本供选择。
chart.js release
moment.js,它是与日期处理有关,有些 bundle 是包含了它的,不过需要自己 build 出来。
utils.js 则是封装了一些实用的工具,比如颜色,具体可以看一下这个文件,里面代码不多。
1
2
3
4
5
6
7
8
9
| window.chartColors = {
red: "rgb(255, 99, 132)",
orange: "rgb(255, 159, 64)",
yellow: "rgb(255, 205, 86)",
green: "rgb(75, 192, 192)",
blue: "rgb(54, 162, 235)",
purple: "rgb(153, 102, 255)",
grey: "rgb(201, 203, 207)"
};
|
注:我使用的库基本上都是没有压缩过的,方便查看源码,一般在真正产品上都是使用像.min.js 这样压缩过的库。
Read file and create data object
使用 jquery 读取文件(像 Chrome 之类的浏览器不支持非 web 应用下的直接文件读取,需要特殊配置)之后,逐行进行解析并加入来数据 list 中,以供后面使用。
注:之前生成的 data 文件是 win 下的,所以用\r\n来 split 获取行,如果是 linux 下的话,就是\n了,为了兼容,其实还是有必要添加额外的 check。
1
2
3
4
5
6
7
8
9
10
11
12
13
14
15
16
17
18
| success :function(data){
records = data.split("\r\n");
records.forEach(function(rec){
if (rec.trim()){
dataRecord = {
time:moment(rec.split(";")[0].split("=")[1], timeFormat).toDate(),
cpuRate:rec.split(";")[1].split("=")[1],
memRate:rec.split(";")[2].split("=")[1]
};
dataRecords.push(dataRecord);
dataLabels.push(dataRecord.time);
cpuData.push(parseFloat(dataRecord.cpuRate));
memData.push(parseFloat(dataRecord.memRate));
}
});
}
|
获取 h5 canvas
下面是标准的 html5 画布上下文,以供 chartjs 使用。
1
| var ctx = document.getElementById("canvas").getContext("2d");
|
config and draw the chart
下面刚是核心的配置代码,不同的 chart 大同小异,真是提供的 data 不同。
1
2
3
4
5
6
7
8
9
10
11
12
13
14
15
16
17
18
19
20
21
22
23
24
25
26
27
28
29
30
31
32
33
34
35
36
37
38
39
40
41
42
43
44
45
46
47
48
49
50
51
52
53
54
55
56
57
58
59
60
61
| var config = {
type: "line",
data: {
labels: dataLabels,
datasets: [
{
label: "CPU",
backgroundColor: color(window.chartColors.red)
.alpha(0.5)
.rgbString(),
borderColor: window.chartColors.red,
fill: false,
data: cpuData
},
{
label: "Memory",
backgroundColor: color(window.chartColors.blue)
.alpha(0.5)
.rgbString(),
borderColor: window.chartColors.blue,
fill: false,
data: memData
}
]
},
options: {
title: {
text: "CPU Memory Monitor"
},
scales: {
xAxes: [
{
type: "time",
time: {
parser: timeFormat,
tooltipFormat: "HH:mm:ss"
},
scaleLabel: {
display: true,
labelString: "Date"
}
}
],
yAxes: [
{
scaleLabel: {
display: true,
labelString: "value"
}
}
]
}
}
};
var chart = new Chart(ctx, config);
|
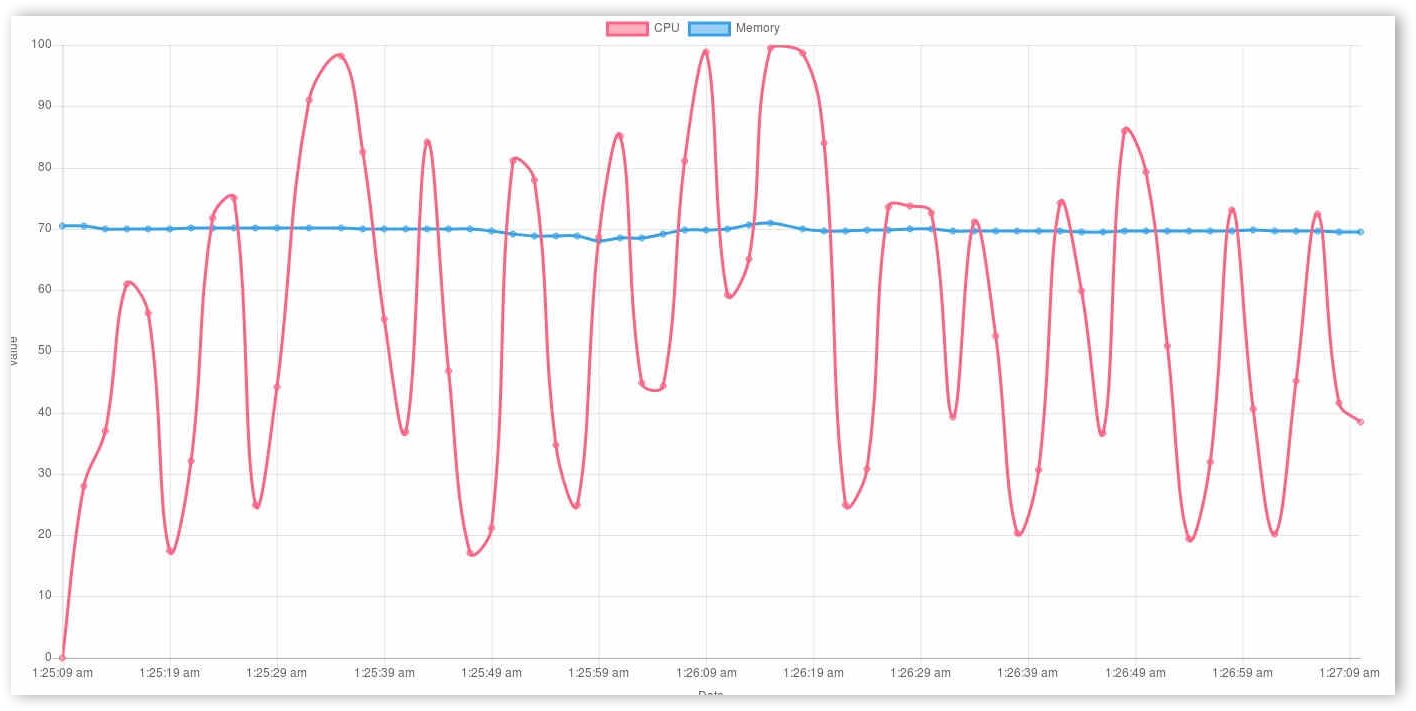
显示效果
Sample
更具体的信息参考:chart.js
我的 demo:Monitor